Data collector install
All components for collecting metrics from the Atoms and transmitting data to Eyer can be deployed to a separate host (for test-setups, all components can be deployed to the Atom host).
Download these three components to setup the Eyer connector:
- Jetty (version 12 or higher)
- Influx Telegraf open source data collector
- Jolokia (war unsecured agent, version 2.02 or higher) x
Exposing JMX ports on your Atom
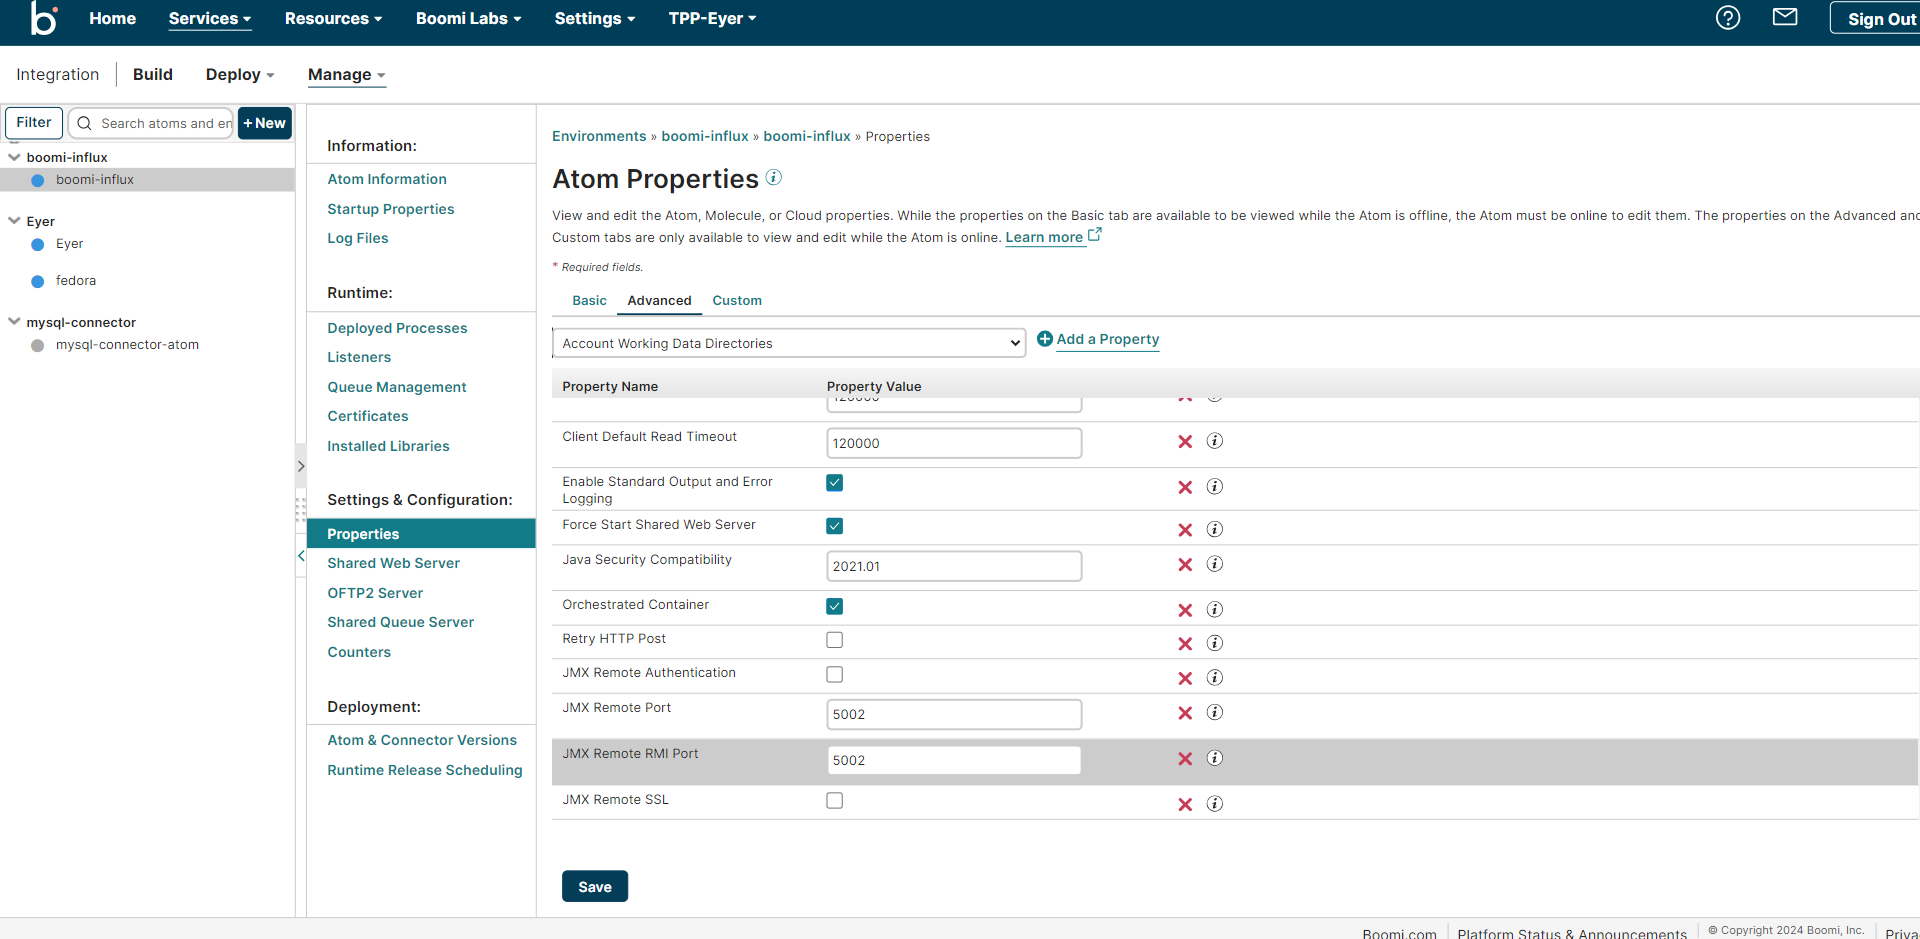
Log in to your Boomi AtomSphere account and select your Atom. Navigate to the Properties -> Advanced tab to add and expose the following JMX ports on your Atom:
- JMX Remote Port -> Property Value of 5002
- JMX Remote RMI Port -> Property Value of 5002
- JMX Remote SSL -> Disable this property by leaving its property value checkbox unchecked
- JMX Remote Authentication -> Disable this property by leaving its property value checkbox unchecked
Each of your Atoms should look like this when you are done.

Save and restart your Atom to see the changes.
Deploying Jolokia in a Jetty server
After you've set up and configured your Boomi Atom, the next step is to create and deploy the Jetty server that will hold your Jolokia agent. To do that follow these steps:
- Create a
JETTY_HOMEvariable pointing to your downloaded and extracted Jetty folder with this command. This documentation uses PowerShell as an administrator. If you're using a different terminal, refer to the documentation for instructions on creating variables in various terminals.
$JETTY_HOME= "path to your jetty-home folder"
- Create and change your present directory into a jetty-base folder with this terminal command.
mkdir jetty-base
cd jetty-base
- Next, run this command to create the
$JETTY_BASE/start.d/directory and other configuration directories for the Jetty server.
java -jar $JETTY_HOME/start.jar --add-modules=server,http,ee10-deploy
- Deploy the Jetty's demo web applications with this command.
java -jar $JETTY_HOME/start.jar --add-module=demos
-
Rename your downloaded Jolokia file to
jolokia.war. Then, navigate to the jetty-base folder you created earlier (step two) and locate thewebappssubfolder within it. Copy the renamedjolokia.warfile into thiswebappsfolder. -
Start your Jetty server with this command:
java -jar $JETTY_HOME/start.jar
- To verify if your Jetty server is running with your Jolokia, go to http://localhost:8080/jolokia/.
Installing Telegraf
Telegraf is an open-source agent that collects metrics from your applications. To run your Telegraf as a service, download the Eyer eyer_agentless_telegraf.conf file from this link.
Next, copy the eyer_agentless_telegraf.conf file into your InfluxDB Telegraf folder, typically located at C:\Program Files\InfluxData\telegraf\telegraf-1.30.1\telegraf. Then, make the following edits to your Eyer eyer_agentless_telegraf.conf file:
- Enable authentication using your Eyer agent API token: Locate the
[outputs.http.headers]section, in this section, replace the authenticate field's value with your Eyer agent API token.
[outputs.http.headers]
  	authenticate = "your_api_key"
-
Configure Jolokia connection: In the
# # Read JMX metrics from a Jolokia REST agent endpointsection, make the following changes:-
Duplicate the
[[inputs.jolokia2_proxy]]section, along with all metrics, for each Atom you wish to monitor. If you're monitoring only one Atom, skip this step. -
Edit each of the URLs to reflect your Jolokia IP address. Replace the
x.x.x.xpath in the URL with yourjolokiaIP address.# # Read JMX metrics from a Jolokia REST agent endpoint
[[inputs.jolokia2_proxy]]
url = "http://x.x.x.x:8080/jolokia" -
Next, edit each of the urls in the
[[inputs.jolokia2_proxy.target]]section to reflect the IPs where your atoms are hosted. Replace thex.x.x.xpath in the URL with your Boomi Atom’s IP address.[[inputs.jolokia2_proxy.target]]
url = "service:jmx:rmi:///jndi/rmi://x.x.x.x:5002/jmxrmi"
If you only monitor a single atom, and your Telegraf agent is hosted in the same location as the Jolokia agent, use this url:
 [[inputs.jolokia2_proxy.target]]
url = "service:jmx:rmi:///jndi/rmi://localhost:5002/jmxrmi" -
-
Save the changes made to the
eyer_agentless_telegraf.conffile. -
Once you’ve made your changes to the
eyer_agentless_telegraf.conffile. Register and start your Telegraf agent as a service by following the commands in the Telegraf official documentation.-
For Windows users: Open Powershell as an adminstrator. In the PowerShell window, run the following commands to navigate to the Telegraf folder and move the
telegraf.exe,telegraf.conf, andeyer_agentless_telegraf.conffiles:cd "C:\Program Files\InfluxData\telegraf";
mv .\telegraf-1.30.3\telegraf.* .Next, install telegraf as a service with this command:
.\telegraf.exe --service install `
--config "C:\Program Files\InfluxData\telegraf\eyer_agentless_telegraf.conf"
Run this command to test your Telegraf installation. If successful, you'll see your Atom metrics.
.\telegraf.exe `
--config C:\"Program Files"\InfluxData\telegraf\eyer_agentless_telegraf.conf --test
Start telegraf as a service using this command:
.\telegraf.exe --service startCheck if your Telegraf service is running using this command:
Get-service Telegraf -
For Linux users, start your Telegraf agent with this command:
sudo systemctl start telegraf
For other operating systems not listed here, check out the official Telegraf documentation.
-